
Women are hit harder
by the indirect impacts of Covid-19 on NHS waiting lists
Our viewpoint
4 July 2021


The Covid-19 pandemic sent shockwaves through the NHS. Resources had to be reprioritised urgently and were stretched thin coping with rising infections, hospitalisations and deaths. Now, more than a year since the first lockdown, the indirect impacts of Covid-19 on other aspects of the NHS are becoming clear, and one that requires significant attention is the increase in waiting times for specialist treatment.
In England, there are over five million people currently on NHS waiting lists, a fact that has been widely reported. But underneath the headline number, there are significant inequalities in waiting list sizes and waiting times across the country. We recently launched the NHS Waiting List Tracker to help decision makers and the public investigate these differences, and revealed significant regional disparities in increased waiting times, particularly for those waiting over a year to see an orthopaedic specialist.
We now also know that increased waiting times have hit some specialties, and sections of society, harder than others, and that women are being particularly disadvantaged.
Waiting lists for gynaecology have been impacted disproportionately
Between February 2020 and April 2021, the total waiting list increased by almost 700,000, and now exceeds five million, an increase of 16%. However, this change has been felt unequally across specialties, with gynaecology experiencing the largest percentage increase in waiting list size at 34%, over double the average across all specialties.

Exploring the absolute numbers reveals a greater sense of the burden carried by the only female specialty. The chart below shows the increase in waiting list size between Feb 2020 and April 2021 (the dashed bar), and how this is broken down by the increases in different specialties (the solid bars).

Discounting the ‘other’ category (a collection of specialties), gynaecology has had the second largest increase in waiting list size (up from 286,000 to 382,000, an increase of 96,000 pathways), behind trauma and orthopaedics (up 116,000). However, while anyone may require orthopaedic care, gynaecology only affects women and those assigned female at birth (AFAB), therefore only approximately 51% of the population. Adjusting for this puts gynaecology, the only women’s/AFAB specialty firmly ahead as the hardest hit by the pandemic with regards to waiting list size, in both percentage terms and absolute increases. In absolute terms women will be most affected by this but it should be noted that this will also impact non-binary, trans-men and anyone requiring gynaecology services. Each number represents an ‘incomplete pathway’ which is an individual patient referral on a waiting list. A patient may be referred for more than one issue hence the number of individual patients on any waiting list may be slightly lower than the number of incomplete pathways. For ease of reading we use ‘patients’ throughout this article when referring to incomplete pathways.
The impact on gynaecology is not new
While clearly exacerbated by the pandemic, gynaecology’s waiting list problem is unfortunately not new. Comparing the number of people waiting each month relative to the number waiting in April 2018 (where 1 would be the same number waiting, 2 would be twice as many waiting etc), the increase in gynaecology’s waiting list outstrips that for all specialties consistently. As of April 2021, the gynaecology waiting list is 60% larger than it was in 2018, again the largest value of all individual specialties and far above the value across all specialties (27% higher).

There are regional disparities, too
As of April 2021, there were 382,000 patients waiting for gynaecology treatment across England. However, there are large regional differences in how many are waiting, and how long they are waiting for.
Accounting for population size, we see six times more patients waiting in Manchester (1,577 per 100,000) compared to East Sussex (261 per 100,000).
Inequalities widen significantly when considering those waiting more than a year to see a gynaecology specialist, far above the NHS target of being seen within 18 weeks of referral. In Barnsley, there are just 4 patients per 100,000 waiting more than a year to see a gynaecology specialist. In Manchester, this number is 56 times higher, at 226 per 100,000. And when considering the number waiting more than a year as a percentage of the total waiting list, again significant differences emerge. Just 0.7% of the gynaecology waiting list in Berkshire have been waiting over a year, compared to 15.9% in Leicester.
Looking at the number of patients waiting for over a year for gynaecology treatment across all CCGs in England, the longer waiting lists are generally found in the north and east of England, with a few notable exceptions such as Barnsley and Northumbria, which are ranked 1st and 4th for performance in this category out of 106 CCGs. Resources will therefore need to be targeted more proportionately to ensure this aspect of recovery from the pandemic is uniform across the country.
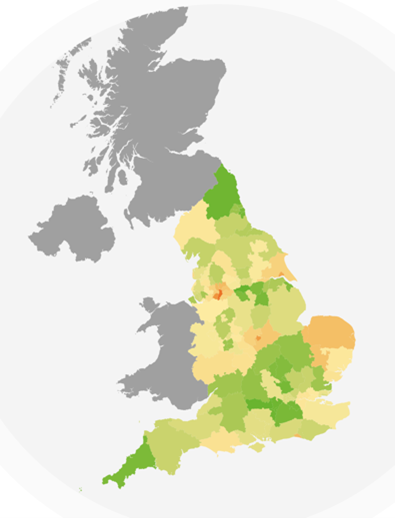
The number of people per 100,000 waiting more than 52 weeks for gynaecology treatment as of April 2021
Conclusions
More people are waiting, and waiting for longer, for specialist treatment as an indirect impact of the pandemic. But these high-level figures mask significant inequalities in how regions, specialties and sections of society have been impacted.
Gynaecology has seen the largest percentage increase in its waiting list over the course of the pandemic, and, accounting for it being primarily a female-only specialty, has had the largest absolute increase as well. Within this, significant regional disparities emerge, with a postcode lottery of how long patients may need to wait for gynaecology treatment.
It will be crucial to take a targeted, data-driven approach in allocating resources to recover from the pandemic. This will ensure resources are aimed at where they are most needed, across specialties, regions and sectors of society.
Data and statistics
Table 1: 10 CCGs with most and fewest patients waiting per 100,000 population for gynaecological services
|
Top 10 |
||
|
Rank |
Clinical Commissioning Group |
Number of incomplete pathways per 100k population |
|
1 |
NHS East Sussex CCG |
261 |
|
2 |
NHS Barnsley CCG |
298 |
|
3 |
NHS Herts Valleys CCG |
336 |
|
4 |
NHS Bassetlaw CCG |
361 |
|
5 |
NHS Kernow CCG |
372 |
|
6 |
NHS Vale of York CCG |
383 |
|
7 |
NHS Oxfordshire CCG |
395 |
|
8 |
NHS North Staffordshire CCG |
413 |
|
9 |
NHS Derby and Derbyshire CCG |
438 |
|
10 |
NHS Morecambe Bay CCG |
442 |
|
Bottom 10 |
||
|
Rank |
Clinical Commissioning Group |
Number of incomplete pathways per 100k population |
|
106 |
NHS Manchester CCG |
1,577 |
|
105 |
NHS Trafford CCG |
1,369 |
|
104 |
NHS Liverpool CCG |
1,260 |
|
103 |
NHS Knowsley CCG |
1,166 |
|
102 |
NHS Birmingham and Solihull CCG |
1,154 |
|
101 |
NHS Salford CCG |
1,153 |
|
100 |
NHS South Sefton CCG |
1,142 |
|
99 |
NHS Stockport CCG |
1,118 |
|
98 |
NHS Leicester City CCG |
1,060 |
|
97 |
NHS Tameside and Glossop CCG |
1,052 |
Table 2: 10 CCGs with most and fewest patients waiting more than 52 weeks per 100,000 population for gynaecological services
|
Top 10 |
||
|
Rank |
Clinical Commissioning Group |
Number of incomplete pathways waiting more than 52 weeks per 100k population |
|
1 |
NHS Barnsley CCG |
4 |
|
2 |
NHS Berkshire West CCG |
4 |
|
3 |
NHS Frimley CCG |
5 |
|
4 |
NHS Northumberland CCG |
5 |
|
5 |
NHS Sunderland CCG |
7 |
|
6 |
NHS Herts Valleys CCG |
7 |
|
7 |
NHS South Tyneside CCG |
7 |
|
8 |
NHS South West London CCG |
7 |
|
9 |
NHS Surrey Heartlands CCG |
8 |
|
10 |
NHS Bassetlaw CCG |
8 |
|
Bottom 10 |
||
|
Rank |
Clinical Commissioning Group |
Number of incomplete pathways waiting more than 52 weeks per 100k population |
|
106 |
NHS Manchester CCG |
226 |
|
105 |
NHS Trafford CCG |
179 |
|
104 |
NHS Leicester City CCG |
169 |
|
103 |
NHS Hull CCG |
149 |
|
102 |
NHS Heywood, Middleton and Rochdale CCG |
122 |
|
101 |
NHS Bury CCG |
122 |
|
100 |
NHS Brighton and Hove CCG |
120 |
|
99 |
NHS Norfolk and Waveney CCG |
117 |
|
98 |
NHS West Suffolk CCG |
110 |
|
97 |
NHS Oldham CCG |
106 |
Table 3: 10 CCGs with most and fewest patients waiting for gynaecological services
|
Top 10 |
||
|
Rank |
Clinical Commissioning Group |
Number of incomplete pathways |
|
1 |
NHS Bassetlaw CCG |
424 |
|
2 |
NHS Barnsley CCG |
736 |
|
3 |
NHS South Tyneside CCG |
808 |
|
4 |
NHS West Lancashire CCG |
813 |
|
5 |
NHS Southport and Formby CCG |
893 |
|
6 |
NHS North Staffordshire CCG |
906 |
|
7 |
NHS East Staffordshire CCG |
956 |
|
8 |
NHS Stafford and Surrounds CCG |
1,020 |
|
9 |
NHS Blackburn with Darwen CCG |
1,086 |
|
10 |
NHS Castle Point and Rochford CCG |
1,105 |
|
Bottom 10 |
||
|
Rank |
Clinical Commissioning Group |
Number of incomplete pathways |
|
106 |
NHS North East London CCG |
16,642 |
|
105 |
NHS North West London CCG |
16,361 |
|
104 |
NHS South East London CCG |
13,765 |
|
103 |
NHS Birmingham and Solihull CCG |
13,620 |
|
102 |
NHS Kent and Medway CCG |
12,947 |
|
101 |
NHS South West London CCG |
10,202 |
|
100 |
NHS Hampshire, Southampton and Isle of Wight CCG |
10,047 |
|
99 |
NHS Black Country and West Birmingham CCG |
9,550 |
|
98 |
NHS Norfolk and Waveney CCG |
8,787 |
|
97 |
NHS Manchester CCG |
8,721 |
Table 4: 10 CCGs with most and fewest patients waiting more than 52 weeks for gynaecological services
|
Top 10 |
||
|
Rank |
Clinical Commissioning Group |
Number of incomplete pathways waiting more than 52 weeks |
|
1 |
NHS Bassetlaw CCG |
9 |
|
2 |
NHS Barnsley CCG |
9 |
|
3 |
NHS South Tyneside CCG |
11 |
|
4 |
NHS North East Lincolnshire CCG |
16 |
|
5 |
NHS Northumberland CCG |
17 |
|
6 |
NHS Sunderland CCG |
18 |
|
7 |
NHS Berkshire West CCG |
19 |
|
8 |
NHS North Tyneside CCG |
28 |
|
9 |
NHS Doncaster CCG |
28 |
|
10 |
NHS St Helens CCG |
33 |
|
Bottom 10 |
||
|
Rank |
Clinical Commissioning Group |
Number of incomplete pathways waiting more than 52 weeks |
|
106 |
NHS Manchester CCG |
1,251 |
|
105 |
NHS Norfolk and Waveney CCG |
1,196 |
|
104 |
NHS North East London CCG |
1,167 |
|
103 |
NHS South East London CCG |
967 |
|
102 |
NHS Kent and Medway CCG |
763 |
|
101 |
NHS North West London CCG |
694 |
|
100 |
NHS Leicester City CCG |
598 |
|
99 |
NHS Coventry and Warwickshire CCG |
597 |
|
98 |
NHS Hampshire, Southampton and Isle of Wight CCG |
558 |
|
97 |
NHS Herefordshire and Worcestershire CCG |
523 |
Table 5: 10 CCGs with most and fewest percentage of patients on gynaecological waiting list waiting more than 52 weeks
|
Top 10 |
||
|
Rank |
Clinical Commissioning Group |
% of incomplete pathways waiting more than 52 weeks |
|
1 |
NHS Berkshire West CCG |
0.7 |
|
2 |
NHS Northumberland CCG |
1.0 |
|
3 |
NHS Frimley CCG |
1.1 |
|
4 |
NHS South West London CCG |
1.1 |
|
5 |
NHS Barnsley CCG |
1.2 |
|
6 |
NHS North East Lincolnshire CCG |
1.4 |
|
7 |
NHS Sunderland CCG |
1.4 |
|
8 |
NHS South Tyneside CCG |
1.4 |
|
9 |
NHS Bedfordshire, Luton and Milton Keynes CCG |
1.5 |
|
10 |
NHS Surrey Heartlands CCG |
1.5 |
|
Bottom 10 |
||
|
Rank |
Clinical Commissioning Group |
% of incomplete pathways waiting more than 52 weeks |
|
106 |
NHS Leicester City CCG |
15.9 |
|
105 |
NHS Hull CCG |
15.1 |
|
104 |
NHS Manchester CCG |
14.3 |
|
103 |
NHS East Leicestershire and Rutland CCG |
14.0 |
|
102 |
NHS Oldham CCG |
13.9 |
|
101 |
NHS Norfolk and Waveney CCG |
13.6 |
|
100 |
NHS Bury CCG |
13.2 |
|
99 |
NHS Trafford CCG |
13.1 |
|
98 |
NHS East Riding of Yorkshire CCG |
13.0 |
|
97 |
NHS Heywood, Middleton and Rochdale CCG |
12.9 |
NHS waiting list tracker
Visualised by LCP
Explore our interactive tracker to see how waiting lists for NHS services vary across England.
Start here