
Monitoring case
reserves and their adequacy – ultimate projections using reported claims cohorts
Our viewpoint
26 November 2021

This is the third instalment in our series of blogs on improving your reserving through better analysis and understanding of case reserves. If you have missed our prior instalments, you can find them here.
In this blog, I look at case reserve analysis using reported claims cohorts. Where the date of notification is available, you can investigate the relative strength of case reserves over time by considering the development of reporting cohorts and considering the relative historical development of the IBNER over time.
Examples
Considering the development of case estimates over time
Plotting case estimates over time allows you to see how they typically develop over the life of a claim. For example, the chart below shows the incurred as a percentage of the incurred after 1 year of development for each reporting year. Since - by definition - no more claims can be added to the cohort, the change in the incurred position is solely driven by increases in the claim amounts over time.
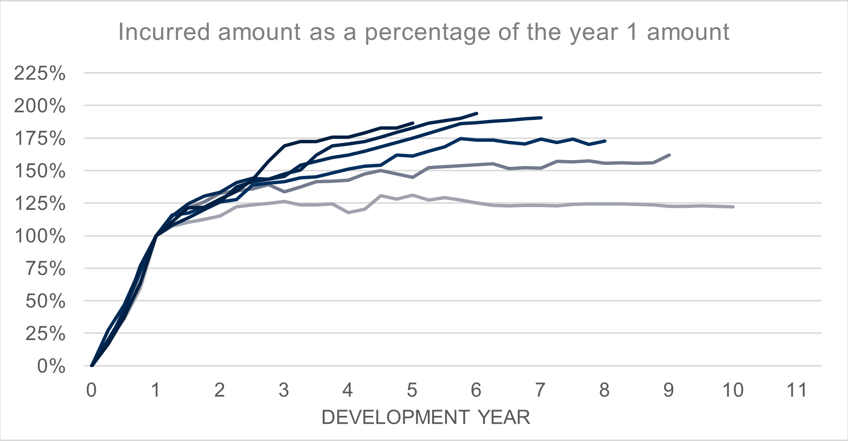
In the above example, the incurred amounts tend to increase after the 1-year point of development; meaning that initial case estimates are usually smaller than the ultimate claims. This inadequacy is not usually a problem for reserving actuaries, as long as the degree of case reserve ‘weakness’ is consistent across cohorts.
However, the example above displays a “fanning out” trend where more recent cohorts have a relatively higher incurred position in later development periods compared to older cohorts. Or more simply, the early case estimates on the more recent claims are further away from their ultimate cost when compared to older claims, suggesting a relative weakening of initial case estimates over time.
Considering the IBNER as a percentage of the ultimate claim amount
Where there is a weakening in case estimates (as above), we might also expect to see an increase in IBNER as a percentage of the ultimate claims.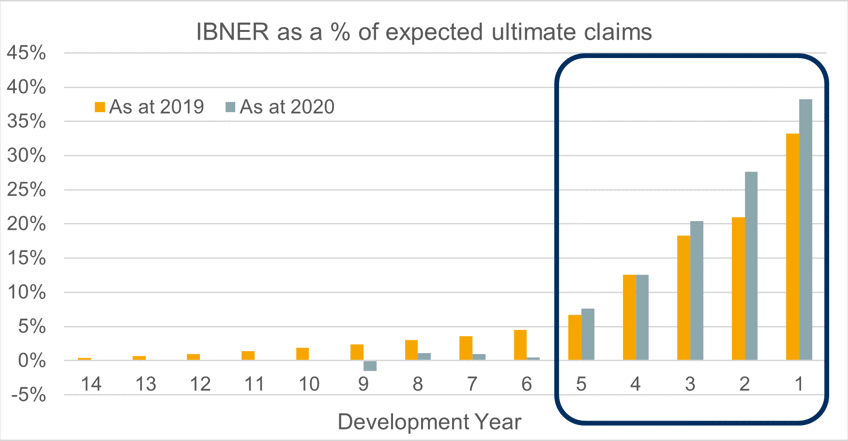
The chart above shows this metric for the reported claims cohort in question at two points in time. We can see that the IBNER as a proportion of the ultimate claim amount increases between 2019 and 2020. This highlights the potential inadequacy of case estimates because incurred claims are making up a smaller percentage of ultimate claims than in the previous year. Alternatively, it could be that the overall reserve projection basis has been strengthened, and that the case reserves now make up a smaller part of the overall reserves. When trends like these are identified, you can investigate the drivers by considering potential changes in case reserve setting and whether the case reserves are accurately capturing the expected claims development.
Limitations and implications of the analysis
The analysis above relies on actuaries capturing or having access to the date that claims were reported. Unfortunately, in some cases – such as binders or bordereaux – this data may not be readily available.
However, our blog series covers several different metrics, enabling you to pick and choose your own combination of tools depending on what data is available and which insights you want to prioritise.
Next Steps
In the next instalment, I’ll show you how you can gain deeper insight into case reserve adequacy by comparing current results to those of the previous year.
At the end of the series, we’ll bring the metrics and tools together into a handy ‘best practice’ guide for assessing and tracking your case reserve strength.
I hope you are finding our series insightful, and I look forward to receiving your comments and feedback!