
Left for too long
with no end in sight - why are women still waiting?
Our viewpoint
8 March 2023

A year ago, LCP Health Analytics and the Royal College of Obstetricians and Gynaecologists (RCOG) called on the Government and the NHS to prioritise gynaecology to reduce waiting lists for the shocking numbers of women in long term poor health. With the introduction of the Elective Recovery Plan (ERP) and the Women’s Health Strategy over the last year, have things improved?
The short answer is an emphatic ‘NO’. Gynaecology lists continue to increase, there are now nearly 700,000 women waiting for treatment, and geographical inequalities are still glaringly obvious. While there are signs of small improvements, the impact of the ERP seems to have had less of an effect on gynaecology compared to other specialities. A disproportionate number of women are being left in long term ill-health and discomfort.
Nearly 700,000 women are waiting for treatment across the UK, and there are big variations across countries and regions
As at 31 December 2022, nearly 700,000 women are waiting for gynaecological treatment across the UK. This is almost double that of the waiting list prior to the pandemic, and has increased by 130,000 patients in just a year.
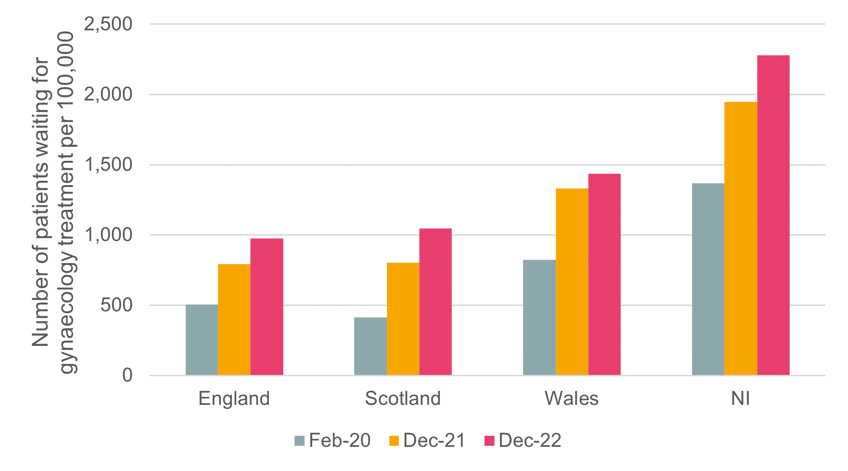
Scotland’s gynaecology waiting list has increased at the fastest rate since the pandemic of all the nations with a shocking 153% rise . In England it is up 93%, in Wales 75% and in Northern Ireland 67%. Northern Ireland has the highest number of patients waiting for treatment by population (Figure 1). The difference in gynaecology healthcare access across the UK nations needs to be better understood and addressed.
Figure 1: Number of patients waiting for gynaecology treatment in the UK by country per 100,000 February 2020, December 2021 and December 2022
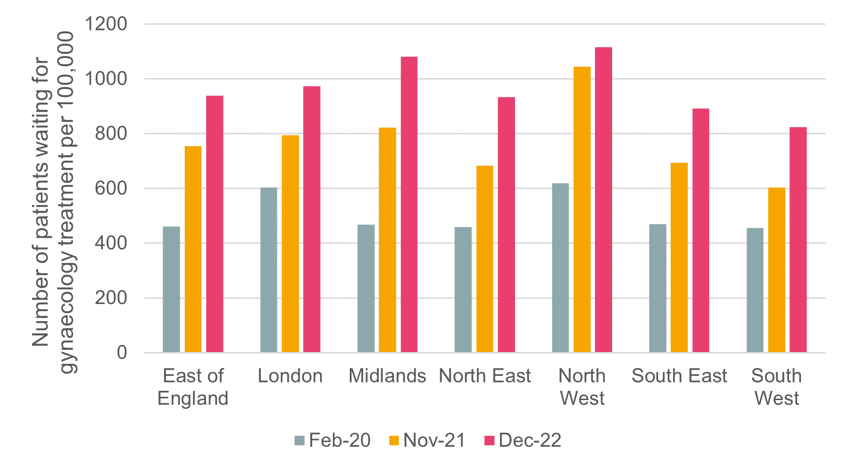
While all regions have observed increases in waiting lists, the rate of increase varies. Waiting lists have increased more than 80% in all regions other than London (62%) since before the pandemic. The North West has consistently observed the highest number of patients per 100,000 waiting for care and continues to be the most impacted region in England. In December 2022, over 1,100 per 100,000 patients (this measure includes the whole population both males and females) were awaiting gynaecology treatment in the North West (Figure 2).
Figure 2: Number of patients waiting for gynaecology treatment per 100,000 by region February 2020, November 2021 and December 2022
Is gynaecology the poor relation among medical specialties?
The gynaecology waiting list has risen at the fastest rate of all medical specialities, with a 93% increase in the number of patients waiting for gynaecology treatment between December 2022 and February 2020. By comparison, the next fastest increase is 70% for plastic surgery.
Since the pandemic, elective waiting lists have been a key issue. The Government and NHS launched the Elective Recovery Plan (ERP) in February 2022, introducing 100 diagnostic centres and additional surgical hubs to help clear high volume routine surgeries. The Government then launched its Women’s Health Strategy in July 2022, aiming to encourage major new research on women’s health issues, increase training of doctors in women’s health, and provide £10 million for breast screening programmes.
In April 2022, LCP Health Analytics and the RCOG highlighted the stark growth in the number of women waiting for gynaecology care and the impact on those women waiting. Figures from December 2021 showed that gynaecology waiting lists across the UK were over 570,00 and had grown by 59% since the beginning of the pandemic. 80% of women interviewed reported worsening mental health due to the wait. LCP Health Analytics and the RCOG called for the reprioritisation of gynaecology and a focused effort by the ERP to reduce waits and inequalities.
While the Women’s Health Strategy and ERP are welcome in terms of raising awareness of the burgeoning problem regarding the ongoing and increasing backlog, and the detrimental impact on these women waiting for care, it is not yet clear how successful they have been.
For instance, the ERP’s first priority was to reduce long waits (i.e. those more than 52 weeks). Between February 2022 (when the ERP was introduced) and November 2022, there was a reduction in the number of patients waiting over 78 weeks for gynaecology treatment. However, at the same time the number of patients waiting for more than 52 weeks increased by more than 50%, suggesting that much more needs to be done for women’s health to meet the ERP’s ambitious target.
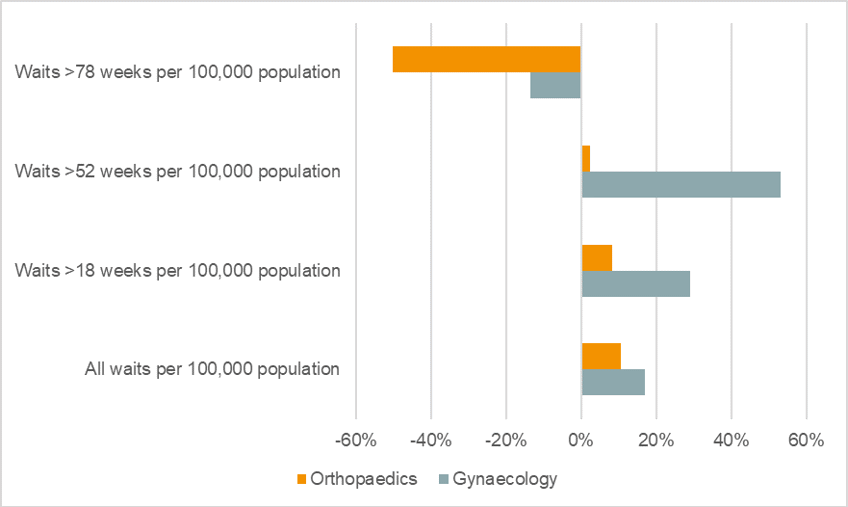
Further to this, there appear to be ongoing inequalities in how the specialities are prioritised. When comparing the impact of the ERP on gynaecology with that of orthopaedics, we found that orthopaedics has not only observed greater relative improvements in those waiting longer for care (waiting >78 weeks), but it has also seen a lower relative increase in shorter waiting times (1 year and 18 weeks) (Figure 3).
Figure 3: The percentage change in the number of patients per 100,000 by weeks waiting between February 2022 and November 2022
Key takeaways
- Waiting lists for gynaecology continue to increase across the country, with Scotland increasing at the fastest rate and Northern Ireland continuing to have the highest number of women waiting per head. Devolved nations should work together to identify why there are such variations in waiting list impact and find new solutions to address this.
- In England, the North West region has the highest number of patients waiting. The persistent high waiting list in this region highlights longstanding inequalities that must be addressed by the Government and NHS to prevent the backlog adding to the poor access to women’s healthcare in this area.
- There has been a reduction in number of long waiters in England, indicating some impact from the ERP, however, other specialities such as orthopaedics have observed a greater change. Significant effort should be made to reprioritise gynaecology and ensure women are not living in pain and discomfort for such unacceptably long periods of time.
Notes on methodology
Methodology is in line with that used in the 'Left for too long’ report and LCP NHS Waiting List tracker.
Where per 100,000 figures are used these have been calculated using ONS Population estimates and include both males and females.
Historical data shown is in line with that used in our February 2022 analysis for RCOG.

Health Analytics hub
Insights hub
The latest news and commentary on how our cutting-edge data modelling across healthcare and life sciences can help our health systems move populations from illness to health.
Enter the hub