
The confusing world
of pension projections
Our viewpoint
29 September 2023

There’s a lot happening at the moment in UK pensions and in particular, in defined contribution (DC) arrangements.
This is great to see as the industry continues to evolve to improve the retirement provision of millions of members. This is despite the industry having been through what feels like an unprecedented period in investment markets. With that in mind, we need to take care that any step forward is not followed by the proverbial two steps backwards.
I’m specifically referring to the new investment projection assumption methodology, known as statutory money purchase illustrations (SMPI). This comes into effect next month, ahead of the much-anticipated Pensions Dashboard. These retirement illustrations are potentially the only communication that members will receive about their retirement savings and which include a projection of the value of their savings at retirement.
Showing sensible, consistent and realistic projections is hugely important in terms of engaging members with their savings. They can support the drive to encourage greater savings and allow members to better understand their likely outcome in terms of helpful adequacy benchmarks such as the PLSA’s Retirement Living Standards. However, this is a complex challenge and as such, it has been difficult to agree on a consistent approach, with only a quarter of the industry preferring the new method. (https://www.frc.org.uk/getattachment/1f27e063-0284-4b7a-b15f-12b993830831/AS-TM1-Version-5-0-feedback-statement.pdf, paragraph 5.12.)
The new approach applying from 1 October 2023 requires all DC pension schemes to project member benefits based on a consistent basis – calculated using the volatility of the returns of their investments over the previous five years. This replaces the current approach where each scheme uses long-term investment assumptions from their provider or adviser which are typically 10-to-15-year capital market assumptions calculated by investment experts.
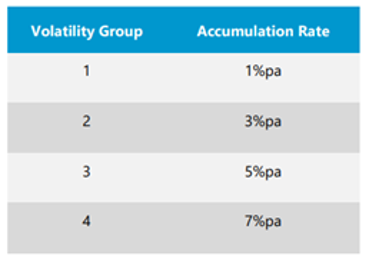
The new approach takes the volatility calculation and assigns a ‘Volatility Group’ which has a corresponding per annum ‘Accumulation Rate’ (see diagram below). The logic behind the approach being that higher risk (i.e. volatility) should be associated with a higher future expected return. In many instances, this may seem broadly sensible over the very long-term.
The issue that this approach creates, however, is that basing anything on just recent market experience currently creates some unexpected and worrying issues.
Take for example the investment volatility of three asset class funds – cash, gilts and equities. Cash type funds have displayed very low volatility and as such are assigned a 1% per annum rate of return using this methodology, even in a high interest rate environment. Global equity-based funds have experienced recent volatility that places many of them in volatility group 3, with a 5% per annum return assigned to them. Gilts, however, are currently experiencing very high levels of volatility – because of, amongst other things, the very rapid changes in inflation and short-term interest rates – as a result, long-dated gilt funds are currently assigned a 7% per annum return, 2% above equity returns.
It should also be worth noting that the new approach does very little to support the government’s drive to focus on outcomes with greater consideration of private market investments. The push to include anything non-daily is dealt with by placing them in the volatility group 3. Again, that might seem reasonable given the lack of historic data and hence, avoiding setting incorrect expectations with members. However, any scheme considering adding a private markets fund which has the potential of earning just 5% before the private market level fees would question their value.
The problem is not confined to individual member projections. It also creates issues for master trusts and the projections of their default investment strategies too. If one were to assume that the growth phase of a default is calculated as a single multi-asset fund – it’s not clear yet how each of the pension providers will be calculating this – then according to the Corporate Adviser’s Master Trust and GPP Default Fund Report (data as at 30 June 2023), over half of master trusts will be projecting member benefits with a return of just 3% per annum before fees.
We need to remember that members see projections in today’s terms. So, the question is, how will members react to a projected real return of less than 0.5% per annum (using the required 2.5% inflation) over a 20-to-30-year retirement savings period in their next benefit statement.
Based on these future benefit projections, if members don’t opt for the 7%-returning-gilt-fund, I suspect that some might simply want to stick their money in a bank account. Given the much higher interest rates on offer, who could blame them.