
A&E waiting times
already as bad as last year with Covid and Flu about to add to existing pressure
Our viewpoint
14 December 2023


Last winter we estimated1 the extent to which delays accessing emergency care were leading to additional deaths. As 2023 progressed, acute pressures eased somewhat but now key statistics show that A&E departments are struggling as much, if not more, than they were at this time last year.
A crucial difference is that hospital admissions resulting from Covid-19 and influenza remain at much lower levels than this time last year. But the winter peak is now beginning, with emergency care already stretched. Here we examine key indicators of pressure in A&E departments and consider how many additional deaths may arise.
Persistent Challenges in A&E
Data published today by NHS England2 shows that the A&E departments are back in a similar position to this time last year. There were 1.8 million attendances to major A&E departments exceeding four hours between September and November 2023 compared with 1.6 million in the same period in 2022. That is an increase of 14%.
Not everyone who attends A&E is admitted. The numbers above include people who were discharged or transferred. An alternative measure is the “trolley wait” – the waiting time from the decision by a clinician to admit the patient and their admission. Between September and November 2023 there were 417,000 patients who waited more than four hours from the decision to admit. That is similar to the same period in 2022 (2% lower).
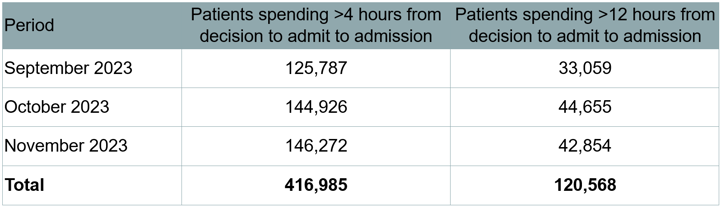
Table 1: Patients waiting more than 4 and more than 12 hours from decision to admit to admission
The picture gets even more bleak when considering those who have had to wait 12 hours or more from the decision to admit. The chart below shows how extraordinary the situation last winter was compared to previous years. September, October and November 2023 have each seen even more 12-hour trolley waits than the corresponding month in 2022.
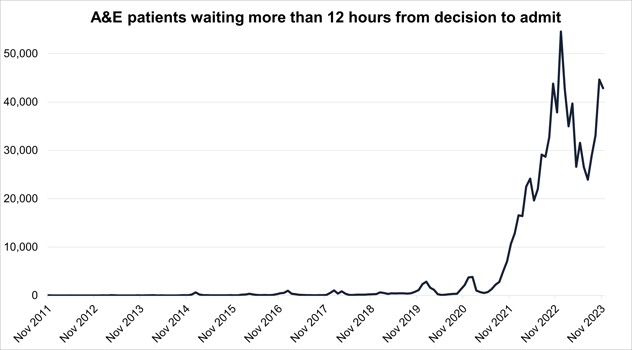
Source: NHSE - Estimated A&E attendance and emergency admissions time series by month
Estimated number of additional deaths
In our earlier analysis, we estimated the number of additional deaths associated with long waiting times in A&E. Using our central approach, based on trolley waits, we estimated 415 additional deaths each week arising from delays between September and November 2022. For the same period in 2023 this is very similar at 407 additional deaths a week.
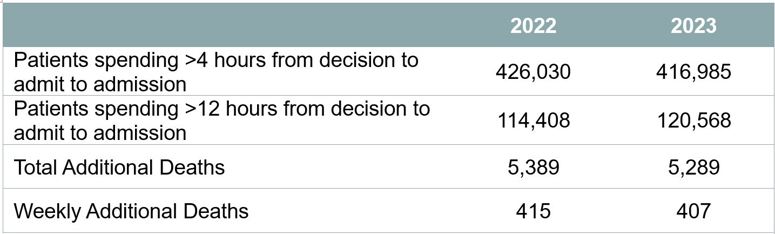
Table 2: Central estimates of additional deaths associated with A&E delays, September to November 2022 versus 2023
As previously discussed, this is likely to be an underestimate as no account has been taken of the waiting time before the decision to admit and we have not allowed for extra harm arising when delays are more than twelve hours.
Covid-19 and influenza
Each winter the NHS has the additional challenge of seasonal influenza to contend with. Covid-19 has added to this burden – while waves can also happen at other times of year, a winter wave is to be expected and we have seen one every year since the start of the pandemic.
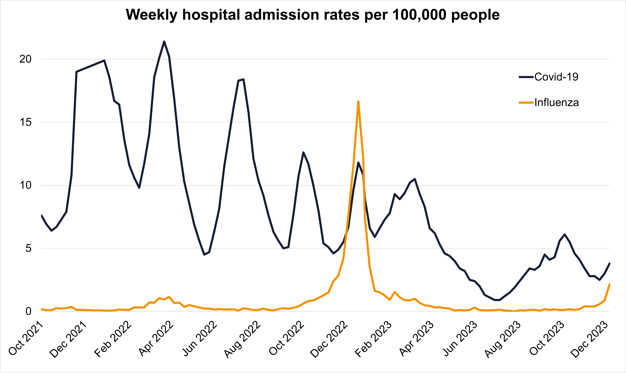
Source: UKHSA - National flu and COVID-19 surveillance reports: 2023 to 2024 season
The A&E pressures described above are despite the fact that admissions from Covid-19 and influenza have been at half the level seen in the same period in 2022. However, the latest national flu and Covid-19 surveillance data from UKHSA3 shows that hospital admissions from each have now started to increase. Covid-19 admissions are up by 27% week-on-week and influenza admissions have rocketed with a 149% week-on-week increase. This will only add to pressures, waiting times and additional deaths.
Conclusion
The winter of 2022/23 was a difficult period for the NHS. Long delays for patients needing to access emergency care led to a significant number of additional deaths. Our new analysis shows that despite far fewer admissions related to Covid-19 and influenza, A&E departments are not faring any better than last year. With admissions from these respiratory viruses now rising sharply, there is little capacity to handle additional strain.
Limitations
Our additional deaths estimate draws on a published study showing the association between delays to patient admissions and all-cause 30-day mortality. The results depend on the relationship between waiting times and 30-day mortality being unchanged since the study period (2016-18).
1 Our analysis from earlier this year of the impact of A&E pressure on additional deaths